
Alright SEHS students, I went ahead and did you a favor and set up a spreadsheet for you to learn and do 6.1.6. Luckily, you should be able to over a version of this spreadsheet in the Apps Google Sheets or Numbers.
A T-test is how researchers determine if there is a Significant Difference between two sets of data. Take a look at the three graphs below…
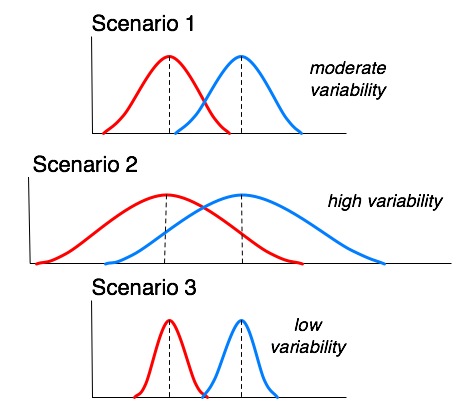
In the first two graphs, there is a large amount of cross-over of the two graphs. What this tells us is that the test creates similar results despite the changed variable. This means that there is NO significant differences.
But in the third graph, less than 5% of the graphs cross over. If this happens then we can say that the two sets of data are Significantly Different, which is the opposite claim of a Null Hypothesis (H0), which says there is no significant difference.
So, when you run a TTest, you are calculating Probability, or P.
- If your P value is > .05, we accept the null hypothesis
- If your P value is < .o5, we reject the null hypothesis (which means there IS a Significant Difference!)
Download the Spreadsheet and follow the directions on how to do the calculation. You will use the result of the test in your quiz as well! If you have further questions, ask me in class or email me at jkubuske@gocathedral.com
